ISMIP-HOM
We begin with an example that does not require any external data; the “Ice Sheet Model Intercomparison Project for Higher-Order Models”.
Set up the model
First, import all the packages we will need:
import issm  as im
import numpy as np
First, create an empty model instance and name the simulation:
md = im.model()
md.miscellaneous.name = 'ISMIP_HOM_A'
Next, we make a simple two-dimensional box mesh with 49 cells in the \(x\) and \(y\) directions over a width of 8 km using squaremesh:
L  = 80000.0
n  = 15
md = im.squaremesh(md, L, L, n, n)
Let the entire domain be defined over grounded ice with setmask:
md = im.setmask(md, 'all', '')
The ISMIP-HOM experiment “A” geometry is created by directly editing the coordinates of the mesh2d instance created above:
# surface :
md.geometry.surface = - md.mesh.x * np.tan(0.5*np.pi/180.0)

# base of ice sheet with 'L' the size of the side of the square :
md.geometry.base = + md.geometry.surface - 1000.0 \
                   + 500.0 * np.sin(md.mesh.x*2*np.pi/L) \
                           * np.sin(md.mesh.y*2*np.pi/L)

# thickness is the difference between surface and base :
md.geometry.thickness = md.geometry.surface - md.geometry.base
We will also need to define the element-wise multiplicative identities:
v_ones = np.ones(md.mesh.numberofvertices)  # rank-zero tensor vertex
e_ones = np.ones(md.mesh.numberofelements)  # rank-zero tensor element
The material parameters may be changed to match those of the ISMIP HOM experiment by changing either the model’s constants or material properties matice:
md.materials.rho_ice    = 910.0              # ice density
md.constants.g          = 9.80665            # gravitational acc.
md.constants.yts        = 31556926.0         # seconds per year
n                       = 3.0                # Glen's flow exponent
spy                     = md.constants.yts   # s a^{-1}
A                       = 1e-16              # Pa^{-n} s^{-1}
B                       = (A / spy)**(-1/n)
md.materials.rheology_B = B * v_ones
md.materials.rheology_n = n * e_ones
While no-slip basal velocity boundary conditions are imposed, the friction coefficient must be defined:
md.friction.coefficient = 1.0 * v_ones
md.friction.p           = 1.0 * e_ones
md.friction.q           = 0.0 * e_ones
Next, configure the model for “ice-sheet” boundary conditions via SetIceSheetBC, extrude vertically 5 cells in the \(z\) direction with extrude(), and set the appropriate “flow equation” with setflowequation:
md = im.SetIceSheetBC(md)  # create placeholder arrays for indicies
md.extrude(6, 1.0)
md = im.setflowequation(md, mdl_odr, 'all')
Now that the 2D mesh has been converted to 3D, we have to redefine the element-wise multiplicitave identies:
v_ones = np.ones(md.mesh.numberofvertices)  # rank-zero tensor vertex
e_ones = np.ones(md.mesh.numberofelements)  # rank-zero tensor element
The no-slip basal-velocity boundary conditions are then set within the model property stressbalance:
md.stressbalance.spcvx = np.nan * v_ones
md.stressbalance.spcvy = np.nan * v_ones
md.stressbalance.spcvz = np.nan * v_ones

basal_v                         = md.mesh.vertexonbase
md.stressbalance.spcvx[basal_v] = 0.0
md.stressbalance.spcvy[basal_v] = 0.0
md.stressbalance.spcvz[basal_v] = 0.0
The periodic-velocity-lateral-boundary conditions specified by the ISMIP HOM experiment are defined by pairing lateral nodes as follows:
minX = np.where(md.mesh.x == 0)[0] + 1
maxX = np.where(md.mesh.x == L)[0] + 1

# for y, maxX and minX should be excluded :
minY = np.where(np.logical_and(md.mesh.y == 0,
                               md.mesh.x != L,
                               md.mesh.x != 0))[0] + 1
maxY = np.where(np.logical_and(md.mesh.y == L,
                               md.mesh.x != L,
                               md.mesh.x != 0))[0] + 1

# set the nodes that should be paired together :
md.stressbalance.vertex_pairing = np.array([np.append(minX, minY),
                                            np.append(maxX, maxY)]).T
Solve the momentum balance
Now, set up the computing environment variables using the generic class, enable verbose solver output with verbose, and finally solve the system with the solve class:
md.cluster = im.generic('name', im.gethostname(), 'np', 1)
md.verbose = im.verbose('convergence', True)
md         = im.solve(md, 'Stressbalance')
Plot the results
You can plot the resulting variables on the surface or the be easily like so:
p   = md.results.StressbalanceSolution.Pressure[md.mesh.vertexonbase]
u_x = md.results.StressbalanceSolution.Vx[md.mesh.vertexonsurface]
u_y = md.results.StressbalanceSolution.Vy[md.mesh.vertexonsurface]
u_z = md.results.StressbalanceSolution.Vz[md.mesh.vertexonsurface]
u   = np.array([u_x.flatten(), u_y.flatten(), u_z.flatten()])
You can then save the data if you like using NumPy:
np.savetxt(out_dir + 'x.txt',   md.mesh.x2d)
np.savetxt(out_dir + 'y.txt',   md.mesh.y2d)
np.savetxt(out_dir + 'u_x.txt', u[0])
np.savetxt(out_dir + 'u_y.txt', u[1])
np.savetxt(out_dir + 'u_z.txt', u[2])
np.savetxt(out_dir + 'p.txt',   p)
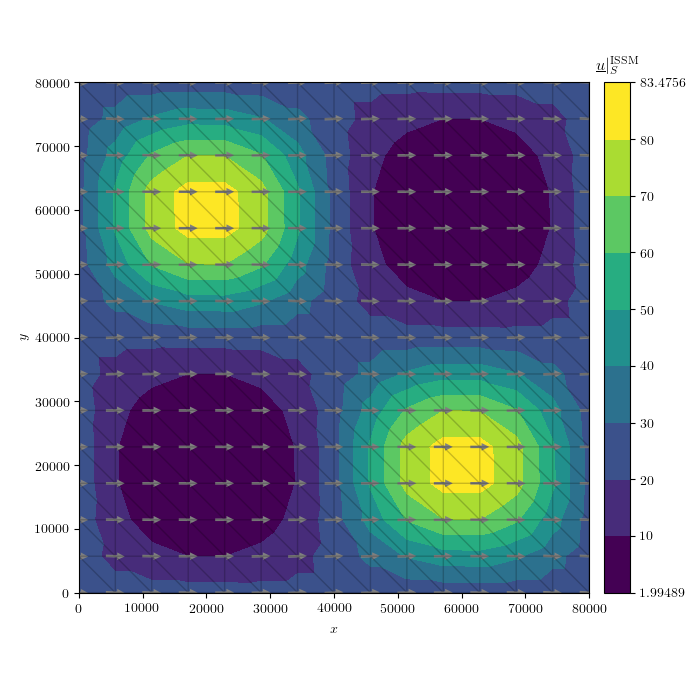
You can utilize the plotting capabilities of the fenics_viz package:
from fenics_viz import *


U_mag  = np.sqrt(u[0]**2 + u[1]**2 + u[2]**2 + 1e-16)
U_lvls = np.array([U_mag.min(), 10, 20, 30, 40, 50, 60, 70, 80, U_mag.max()])

tp_kwargs     = {'linestyle'      : '-',
                 'lw'             : 1.0,
                 'color'          : 'k',
                 'alpha'          : 0.2}

quiver_kwargs = {'pivot'          : 'middle',
                 'color'          : '0.5',
                 'scale'          : None,
                 'alpha'          : 1.0,
                 'width'          : 0.005,
                 'headwidth'      : 3.0,
                 'headlength'     : 3.0,
                 'headaxislength' : 3.0}

plot_variable(u                   = u,
              name                = 'U',
              direc               = plt_dir,
              coords              = (md.mesh.x2d, md.mesh.y2d),
              cells               = md.mesh.elements2d - 1,
              figsize             = (7,7),
              cmap                = 'viridis',
              scale               = 'lin',
              numLvls             = 10,
              levels              = U_lvls,
              levels_2            = None,
              umin                = None,
              umax                = None,
              plot_tp             = True,
              tp_kwargs           = tp_kwargs,
              show                = False,
              hide_x_tick_labels  = False,
              hide_y_tick_labels  = False,
              xlabel              = r'$x$',
              ylabel              = r'$y$',
              equal_axes          = True,
              title               = r'$\underline{u} |_S^{\mathrm{ISSM}}$',
              hide_axis           = False,
              colorbar_loc        = 'right',
              contour_type        = 'filled',
              extend              = 'neither',
              ext                 = '.png',
              normalize_vec       = True,
              plot_quiver         = True,
              quiver_kwargs       = quiver_kwargs,
              res                 = 150,
              cb                  = True,
              cb_format           = '%g')
This will produce a plot of the velocity at the upper surface like this :
